A market correction is coming, we just don’t know when. Good economists know to either make a forecast or state a date, but not to combine the two. Corrections can be healthy for markets, as they shake out the marginal investors, the ones who just want to make a quick buck and leave the longer-term investors in the market.
Takeaway #1
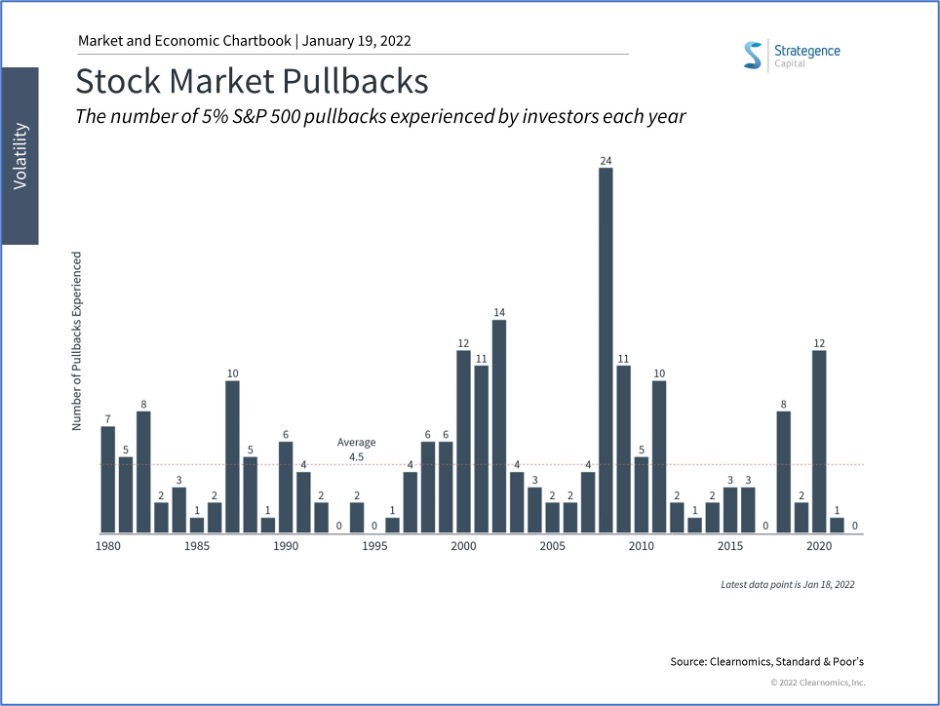
Typically, markets experience 4.5 corrections per year, as evidenced by the chart below.
Takeaway #2
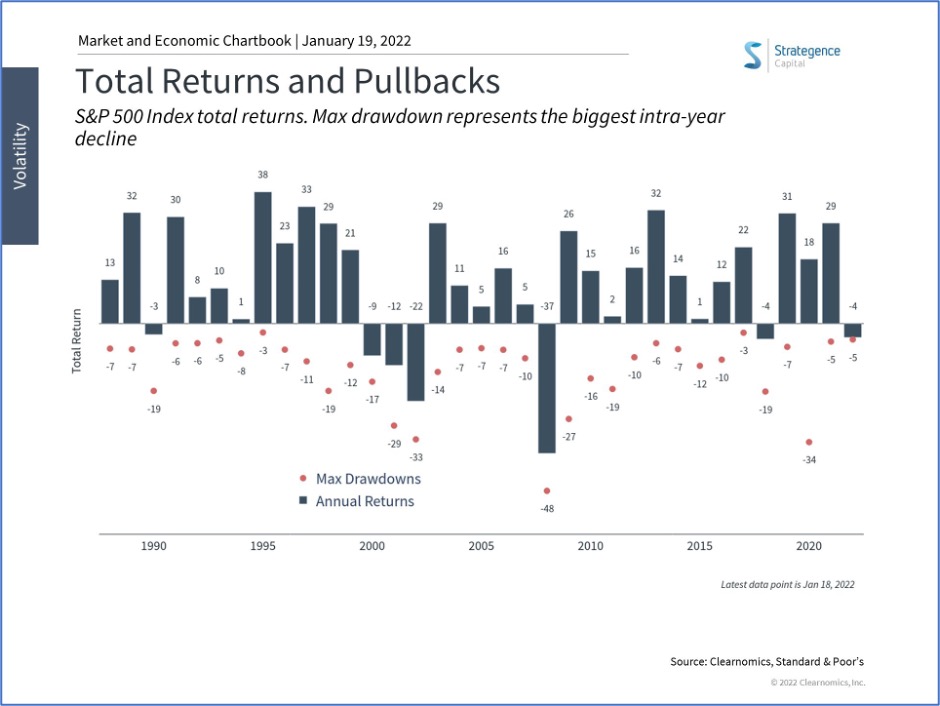
Despite corrections and volatility, in general, the stock market, as measured by the Standard & Poor’s 500, has positive calendar year returns. In the chart below, the red dot below each bar represents the biggest loss suffered during each year. The blue bar shows the total return for the year. So, for example, in 2020, the market was down by 34% (red dot) at its worst but finished the year up 18% (blue bar.)
Takeaway #3
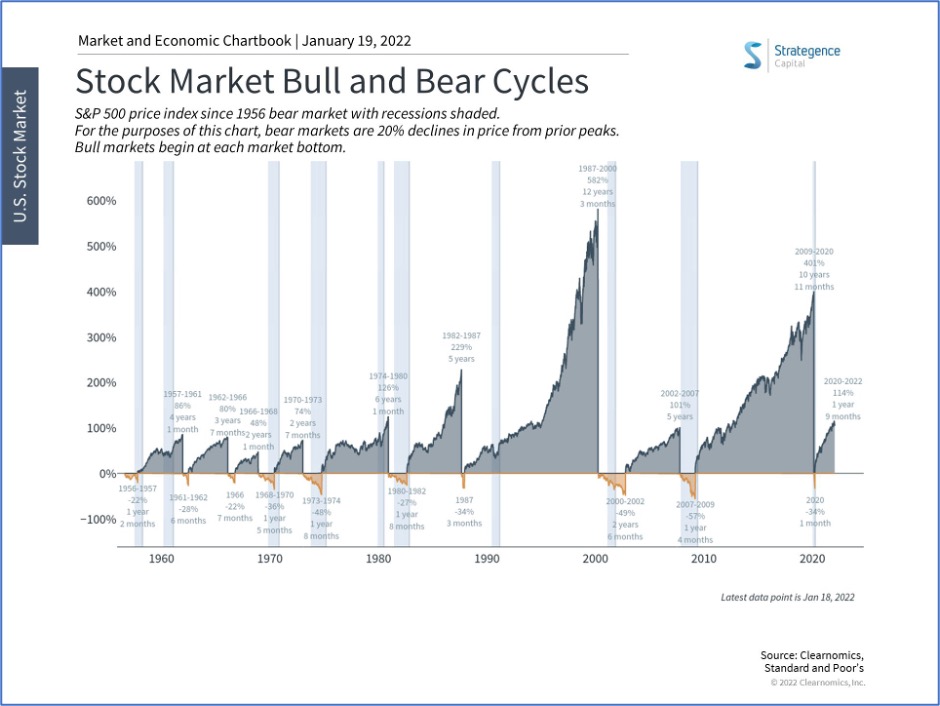
Corrections are one thing, bear markets (declines of 20% or more) are nasty. They can make us wonder if stocks were ever a good thing to invest in. They make investors sell and make ill-timed dashes for cash. They pale, however, both in intensity and duration to bull markets. The average bear market (since 1956) has lasted 14 months, with a peak to trough decline of 36%. In contrast, the average bull market lasts 5 years 9 months and returns 192%.
So, yes, a correction is coming, but we don’t know when—and here’s Takeaway #4—neither does the person on television or the smartest person on Wall Street.
We encourage you to stay invested through all markets. One way to help you remain invested is to have a portfolio appropriate to your ability to accept risk. We can help you determine that portfolio is you head over to Riskalyze and determine your risk number. Click here to do that. We’ll follow up with you.
Content and opinions voice in this material is for general information only and not intended to provide specific advice or recommendations for any individual. All performance referenced is historical and is no guarantee of future results. All indices are unmanaged and may not be invested into directly.
The S&P 500 Index is a capitalization-weighted index of 500 stocks designed to measure performance of the broad domestic economy through changes in the aggregate market value of 500 stocks representing all major industries.
Investing involves risk including loss of principal. No strategy assures success or protects against loss.