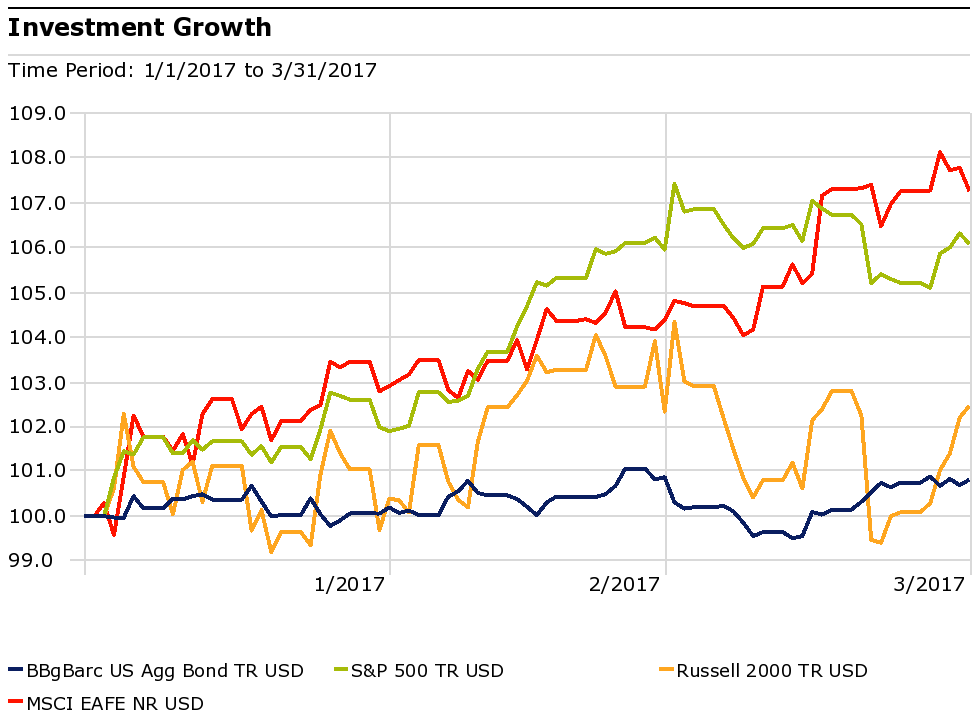
In the first quarter, foreign stocks led the way amongst the indexes herein reported every quarter. Large-cap U.S. stocks came in second place, while among the equity indexes, small-cap stocks brought up the rear. The bond index showed, for the second quarter in a row, the role of bonds in a diversified portfolio, lower volatility. In days of yore, the bond index line might have had a slight, upward tilt to it, accounting for interest rates that were statistically different from zero. [Note to Compliance: that was hyperbole.] The equity index ranking precisely reversed that of the fourth quarter.
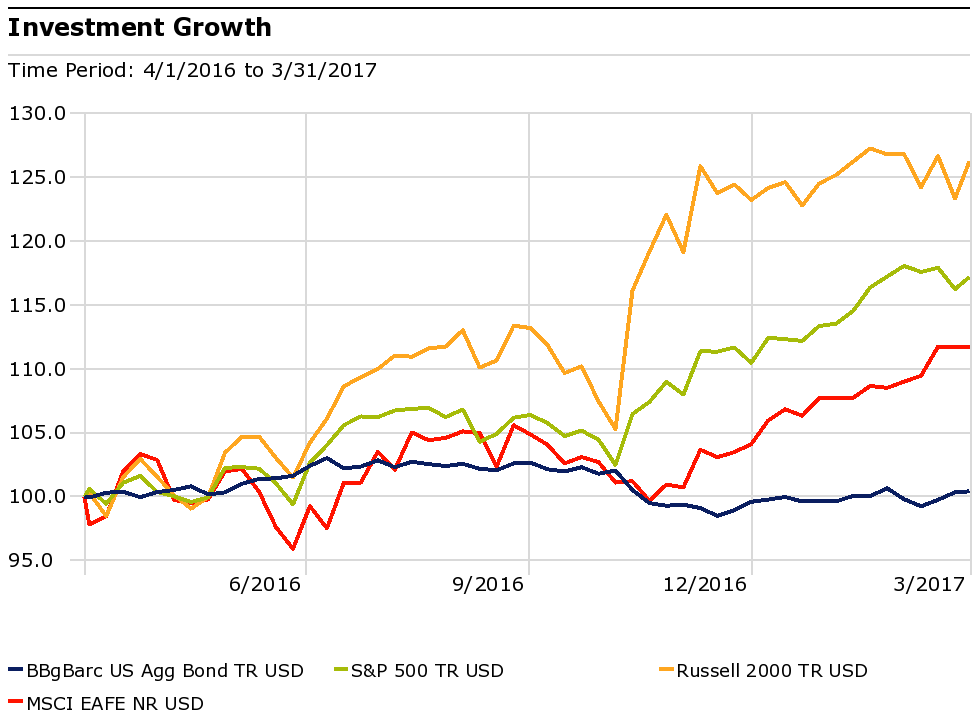
Still, as can be seen on the chart below, on a year-over year basis, small-cap stocks have been the runaway winner, followed by large-cap U.S. stocks, and developed foreign stocks. We will leave it to the talking heads on financial television and other media outlets to divine the reasons for each squiggle. It is a fool’s errand and will not be done here.
During the quarter, the Federal Reserve announced its third rate hike since the Financial Crisis.
“So what,” you say. “How is that relevant to me? No one except for a few banks can borrow money at the Federal Funds rate.”
The answer to the question can be found in the answer to “why does the Federal Reserve change interest rates?” The Federal Reserve (the Fed) changes rates because rate changes are the primary tool in its monetary-policy toolbox, with which it tries to fulfill its so-called dual mandate of promoting price stability and full employment. More specifically, the Fed raises interest rates when it wants to slow down the economy, to reduce the risk of it overheating, which overheating comes in the form of inflation. Higher interest rates slow economic activity of consumers and businesses, both of which groups incur higher costs for borrowing. You might remember from an economics class that higher prices (interest rates are the prices of money) lead to a decrease in quantity demanded; i.e. lower demand for loans.
As the anchor to interest rates in the U.S.—and, frankly, for much of the world—virtually all other interest rates are impacted by the Fed Funds rate. To see this more directly, look at the chart, below, which shows the historic relationship of the 30-year fixed mortgage rate to the Fed Funds rate.
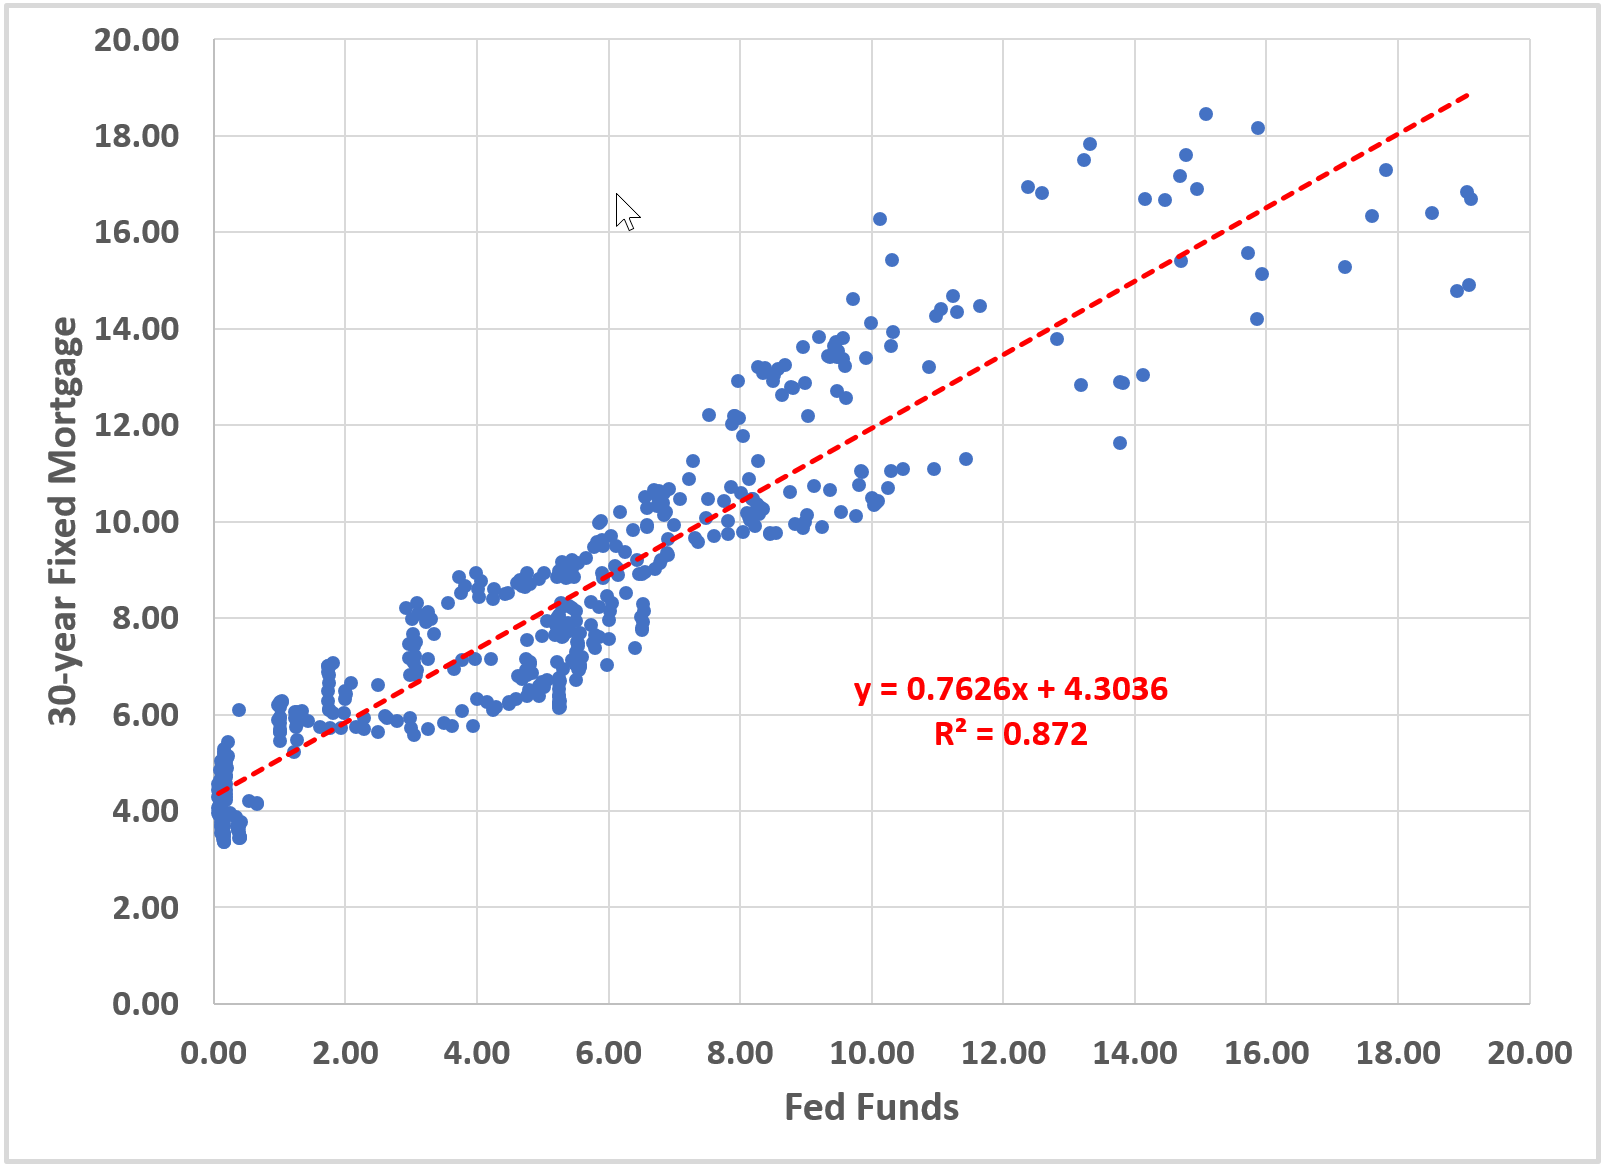
Over time, the relationship between Fed Funds rate and the 30-year fixed-rate mortgage rate has been pretty tight, as measured by R-squared (0.872). Furthermore, the equation for the trendline shows us that, for every 1% increase in the Fed Funds rate, 0.76% (0.7626 times (x) the Fed Funds rate) is transmitted to the 30-year mortgage.
Here is what you need to know:
Fed Funds ↑ → Interest Rates ↑ → Economic Activity ↓
There is so much more that could be said about this. Here are just two things two things. First, this transmission mechanism is loose, and it occurs with a lag, making the Fed’s job akin to driving while looking in the rearview mirror. Second, the bond market is many times larger than the Federal Reserve’s balance sheet and will have its way with interest rates. Oops, I guess that’s three things.
The opinions voiced in this material are for general information only and are not intended to provide specific advice or recommendations for any individual. All performance referenced is historical and is no guarantee of future results. All indices are unmanaged and may not be invested into directly. Investing involves risk including loss of principal.
The prices of small cap stocks are generally more volatile than large cap stocks. International investing involves special risks such as currency fluctuation and political instability and may not be suitable for all investors. Bonds are subject to market and interest rate risk if sold prior to maturity. Bond values will decline as interest rates rise and bonds are subject to availability and change in price.
The Standard & Poor’s 500 Index is a capitalization weighted index of 500 stocks designed to measure performance of the broad domestic economy through changes in the aggregate market value of 500 stocks representing all major industries.
The Russell 2000 Index is an unmanaged index generally representative of the 2,000 smallest companies in the Russell 3000 index, which represents approximately 10% of the total market capitalization of the Russell 3000 Index.
The MSCI EAFE Index (Europe, Australasia, Far East) is a free float-adjusted market capitalization index that is designed to measure the equity market performance of developed markets, excluding the US & Canada.
The Barclays U.S. Aggregate Bond Index is an index of the U.S. investment-grade fixed-rate bond market, including both government and corporate bonds.