The smart folks over at Bespoke Investment Group recently published a piece that looked at returns for the S&P 500 over various timeframes with an eye toward the percentage of returns that were positive. We call these timeframes “investment horizons,” and they’re one of the most important things to think about when it comes to investing. Investopedia says the time horizon is the time until the one “needs the money back.” I’m not in love with that definition, but it’ll work.
One example of a time horizon would be saving for a child’s college education. If the child is four years old and might attend college at age 18, the time horizon is 14 years. Time horizon is so important that we’re required to review it annually with all our clients; it’s one of the most important factors behind an investment decision. It’s the reason that age-based investment products have different asset allocations, depending on the age-group targeted for the product.
Briefly, the shorter one’s investment time horizon, the less volatile those investment should be. Vice versa, the longer one’s horizon, the more volatile the investments can be.
The chart below, using data back to 1928, was produced by Bespoke. It shows the percentage of time that total returns for the Standard & Poor’s 500, a widely-followed measure of stock market returns, have been positive over various time frames. Total return includes not only price appreciation/depreciation but also dividends.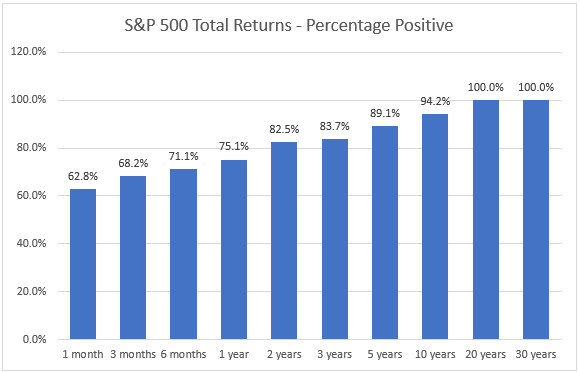
Now we can use that data to think about whether one should invest in stocks, as represented by the S&P 500.
- If you have money to invest for one month, there’s a 37.2% you’ll suffer a loss;
- If you have one decade to invest, there’s only a 5.8% chance you’ll suffer a loss;
- And there’s never been a 20-year period where the total return has been negative.
You can look at these percentages from the other side, too. Over a six-month period, your chance of having a positive return is 70%. That’s not bad. That means that out of ten six-month periods, seven will be positive, but what will your six-month period look like? That’s the big question. I like the odds at five years a lot better. That seems to me to be a good horizon to be thinking about owning stock, but your situation may be different.
Do you wonder if your asset allocation is in keeping with your time horizon? Give us a call or shoot us an email. We’d be happy to discuss this with you.
All investing involves risk including loss of principal. No strategy assures success or protects against loss.
The Standard & Poor’s 500 Index is a capitalization weighted index of 500 stocks designed to measure performance of the broad domestic economy through changes in the aggregate market value of 500 stocks representing all major industries. The S&P 500 is an unmanaged index which cannot be invested into directly. Past performance is no guarantee of future results.