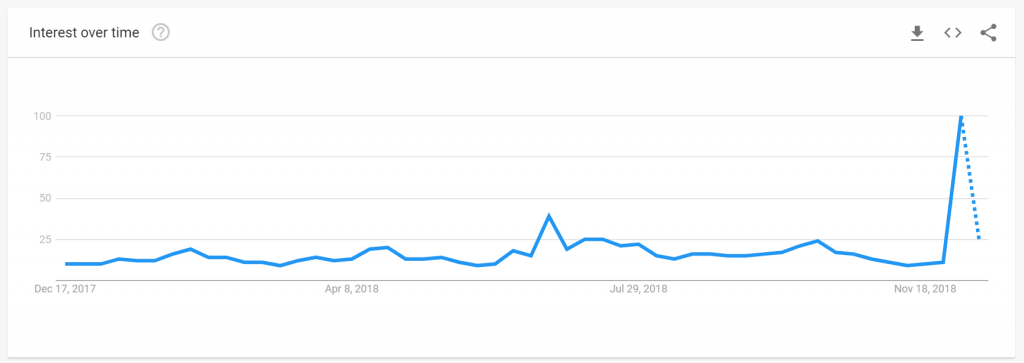
Just one month ago, there were few Google searches on the term “yield curve.” Now, they’ve skyrocketed, as one can see in the chart below.

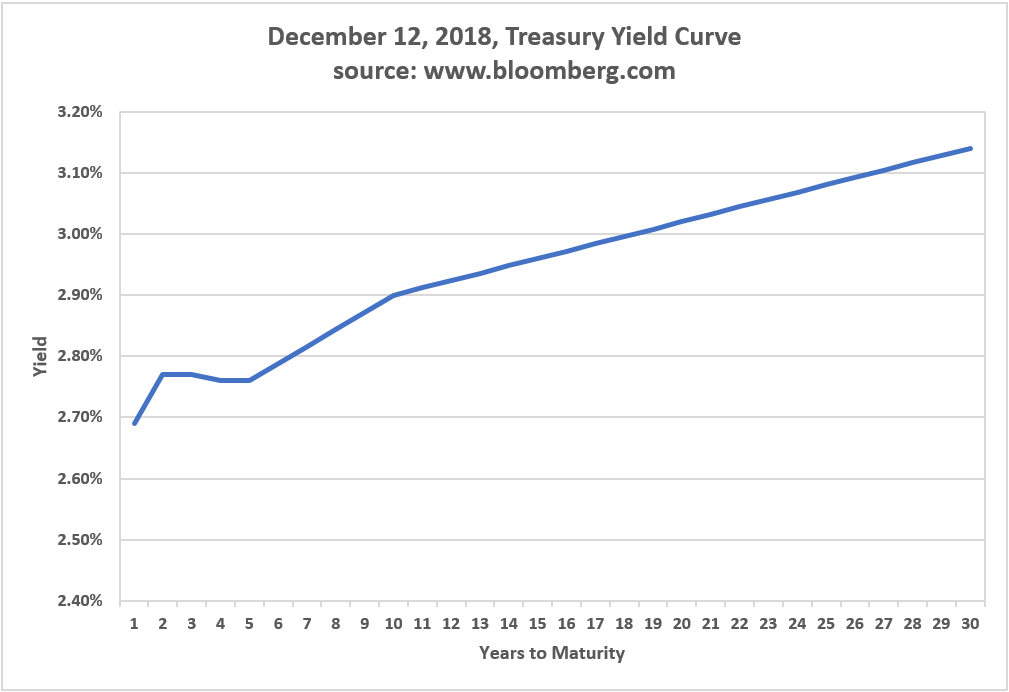
A yield curve is a graphical representation of yields available for various maturities. Shown below is the U.S. Treasury yield curve (source: https://www.bloomberg.com/markets/rates-bonds/government-bonds/us), but a yield curve is also available for your local bank’s CD rates—anywhere one can graph the relationship of yield to maturity.

Okay, so that’s the yield curve, but a similar Google search of “inverted yield curve” would look similar. So, what’s the big deal about an inverted yield curve; it sounds like toe nail + ingrown.
What does it mean when a yield curve is inverted?
The normal shape of a yield curve is positively sloped, with longer maturities yielding more than shorter maturities, to account for the increased uncertainty of holding a 30-year bond to holding a 2-year bond, and also to compensate for inflation. An inverted yield curve is one where, generally speaking, shorter maturities yield more than longer maturities. In the yield curve, above, there is a bit of inversion between two and ten-year Treasuries.
Now, why does this phenomenon strike fear in stock markets?
Simple, because an inverted yield curve has preceded the last seven recessions. As a timing indicator, however, the inverted yield curve is a pretty blunt instrument, as it may indicate a recession is more than two years away. It shouldn’t surprise you that a recession is coming. A recession has been coming since the recovery started in 2009. Also, as you probably know, the most expensive words for investors are this time it is different. Sometimes it is true and this time could be different (though I’m not saying it is).
Reasons to worry
- Recessions are bad for stocks
- The inverted yield curve indicator has a good track record
Reasons to worry less
- Recessions happen periodically. We have managed to get through them
- The sample size (seven recessions) is really small. It’s possible to flip heads or tails seven times in a row, too.
If you’re nervous about your investments, take a look at this LinkedIn post that has some suggestions for possible actions you can take.
Content in this material is for general information only and not intended to provide specific advice or recommendations for any individual. Historical performance is no guarantee of future results. The economic forecasts set forth in this material may not develop as predicted.

