Imagine retiring with an investment portfolio of $1,000,000 and a desire for an annual withdrawal of $40,000 from the portfolio to supplement other income sources. The answer to, “would 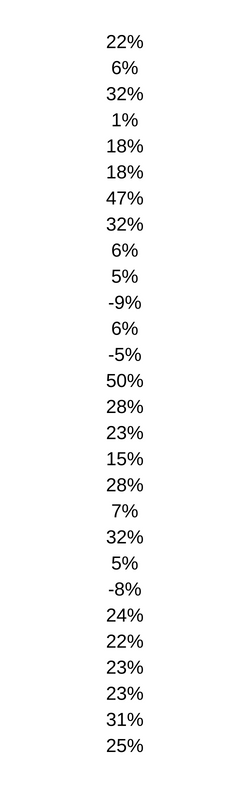 that portfolio be likely to last for thirty years,” is a pretty important one, and it depends a lot on the sequence of returns our retiree experiences.
To explore this, using Excel, I randomly selected 30 annual returns from actual historic returns of the Standard & Poor’s 500 stock market index. Aswath Damodaran, Professor of Finance at New York University, updates those on his website, here, and it’s where I grabbed them from. This isn’t very elegant, but here is the list of annual returns Excel produced for me: Applying those returns, in that order, to our beginning portfolio value ($1,000,000) and distributing $40,000 per year produces a value at the end of 30 years of $30,885,273, making for a comfortable retirement and happy heirs.
Better yet, if we luck out and get the best returns first and the worst returns last, we end up with $35,893,781.
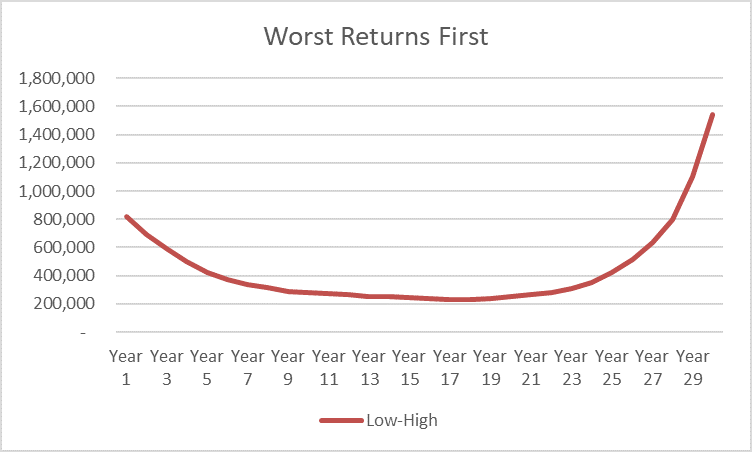
On the other hand, if our hypothetical retiree gets the worst returns first, the value at the end of 30 years is just $1,545,491. Alarmingly, in year 17, the portfolio’s value is just $231,097, with our retiree oblivious that only great years are ahead; and likely to abandon ship.
The point of these exercises isn’t to see what happens in the unlikely event that the returns rank order themselves, rather, to show the devastating effect of getting some nasty years early in retirement.
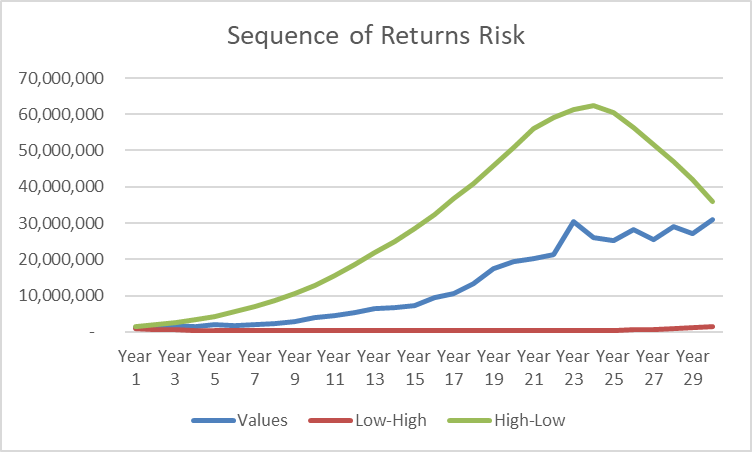
Here it is graphically, if that works better for you. The blue line is the value with the returns in the order above; red is when the worst returns come first; green is when the best returns come first.
The chart above doesn’t show the drama behind the worst-returns-first scenario. It would be a nailbiter; this chart does.
What is one to do to manage the sequence of returns risk? One approach can be found in what is called the “glide path” of so-called Target Date investment products. These begin, some time before retirement, to reduce the exposure to equity (stocks) in favor of fixed income (bonds) or other traditionally less-volatile investments. While every vendor has its own version of a mousetrap, all achieve their lowest equity allocation some time around retirement, when the sequence of returns risk is at its highest. In his blog post, “4 Ways to Manage Sequence of Returns Risk in Retirement,” Wade Pfau suggests four ways:
- Spend conservatively (i.e. lower withdrawal rates)
- Maintain spending flexibility
- Reduce volatility
- Buffer assets (i.e. hold some cash)
Another good source of information is this blog post I’ve had bookmarked for some time, “Understanding Sequence Of Return Risk – Safe Withdrawal Rates, Bear Market Crashes, And Bad Decades,” by Michael Kitces.
Naturally, we would be happy to help you think through this process.
The opinions voiced in this material are for general information only and are not intended to provide specific advice or recommendations for any individual. All performance referenced is historical and is no guarantee of future results. All indices are unmanaged and may not be invested into directly. All investing involves risk including loss of principal. No strategy assures success or protects against loss.
This is a hypothetical example and is not representative of any specific situation. Your results will vary. The hypothetical rates of return used to not reflect the deduction of fees and charges inherent to investing.