
The authorities on these sorts of things say that stories are one of the most powerful ways to get out a message. One story I always trot out has to do with the perils of market timing, which folks are wont to do. Here it is.
In my previous job, I was managing an investment portfolio for a high net worth client. In the city where I worked, the client’s name and/or his enterprises would have been well known. He was a tremendously -successful entrepreneur.
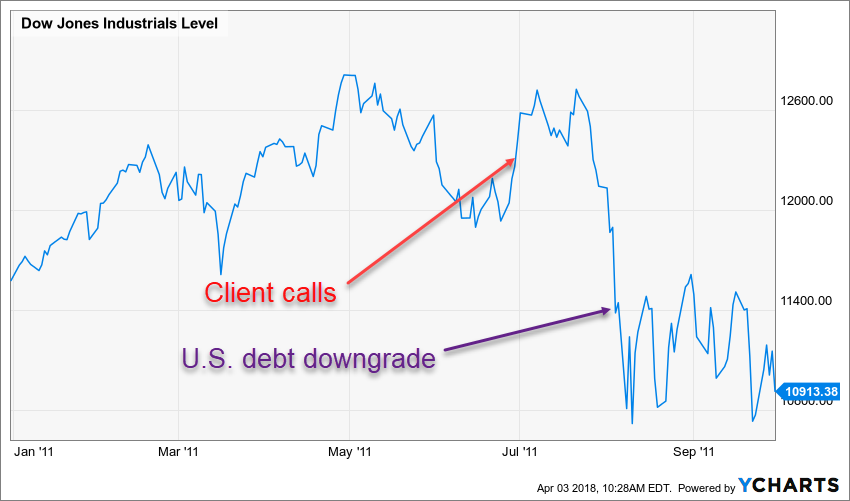
On June 29, 2011, he called me to tell me that he wanted to sell everything—all of his publicly-traded securities. I reminded him that he owned a diversified portfolio, that maybe we should just sell what seemed to be the riskiest securities. Nothing doing; sell everything!
Brilliant!
His timing wasn’t quite perfect; he gave up some upside, assuming his portfolio resembled the Dow Jones Industrial Average index (DJIA), which is shown here. But by August 5 of that year—barely a month later—the U.S. debt had been downgraded by rating agency Standard & Poor’s, and a few days later, the DJIA lost 16% of its value.
One problem with market timing, however, is that for it to be successful, one has to make two right decisions, the proverbial buy low/sell high or vice versa. And, unfortunately, my guy only got half the process right.
Oops!
Here’s a look at the DJIA, starting at the end of the chart, above, and ending when I said “so long” to that firm. On the day I left, he still had not gotten back into his investments. His account remained invested in a money market fund. He expected another shoe to drop.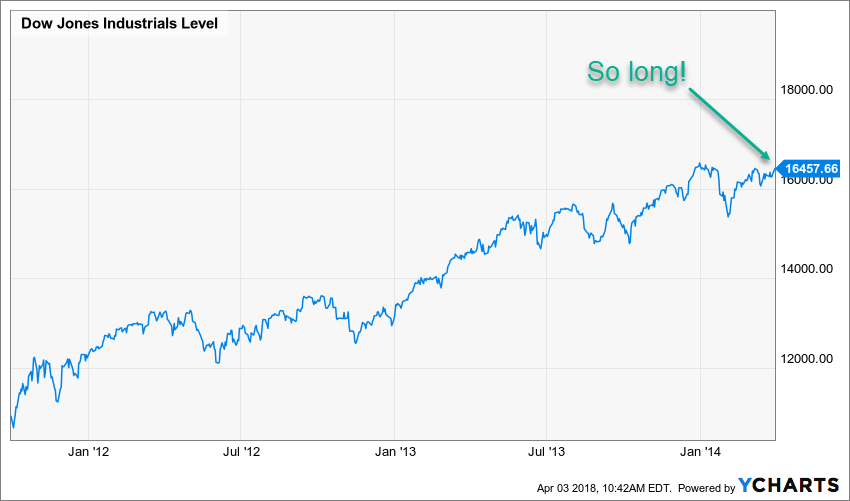
So, what if you knew a market you were invested in would drop by 16%? Let’s further say you knew it would drop by 16% in a given calendar year; would you get out, not knowing when it would rebound? You might be suffering from Hindsight Bias about right now, as you’re sure you would’ve gotten—or would get—back in at some point below where you sold.
What 16% drop?
Here’s a look at that 2011 drop highlighted in an unrealistically-long investment horizon. It’s almost imperceptible—it’s no Burst Internet Bubble or Financial Crisis.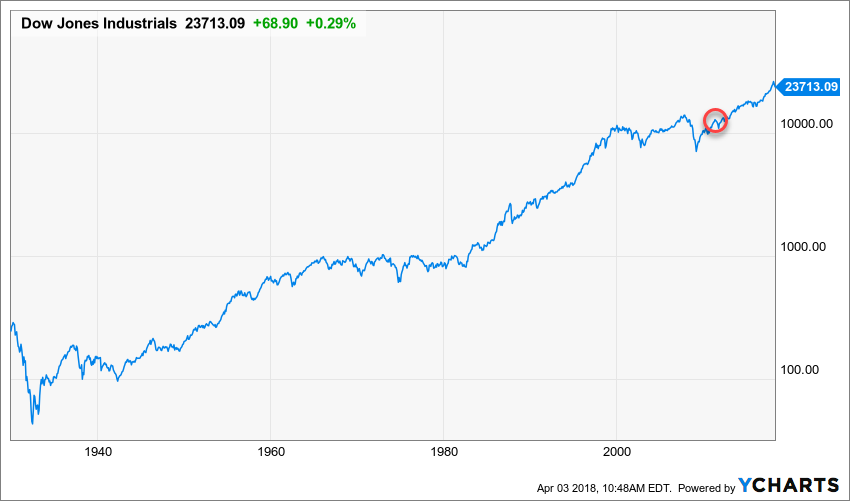
This chart is shown with a logarithmic scale, which means that equal distance on the chart represents the same percentage change. Whatever the size of the device on which you’re viewing this chart—smartphone, desktop computer—a given vertical measurement…1/2”, 1”…represents the same percentage change at any point in the chart. I mention that because while it gives the blip (red circle, below) the appropriate non-impact, it doesn’t reflect the dramatic opportunity cost of being out of the market. The DJIA was 86% higher from June 29, 2011 through March 31, 2014. Missing an increase like that can put a serious dent in one’s financial plan.
Content in this material is for general information only and not intended to provide specific advice or recommendations for any individual. All performance referenced is historical and is no guarantee of future results. All indices are unmanaged and may not be invested into directly. No strategy assures success or protects against loss.