Except for those who bailed out of stocks early in the year, feeling they were overextended, most market participants should be pleased with 2017 results. This is how the year shaped up for seven broad indexes.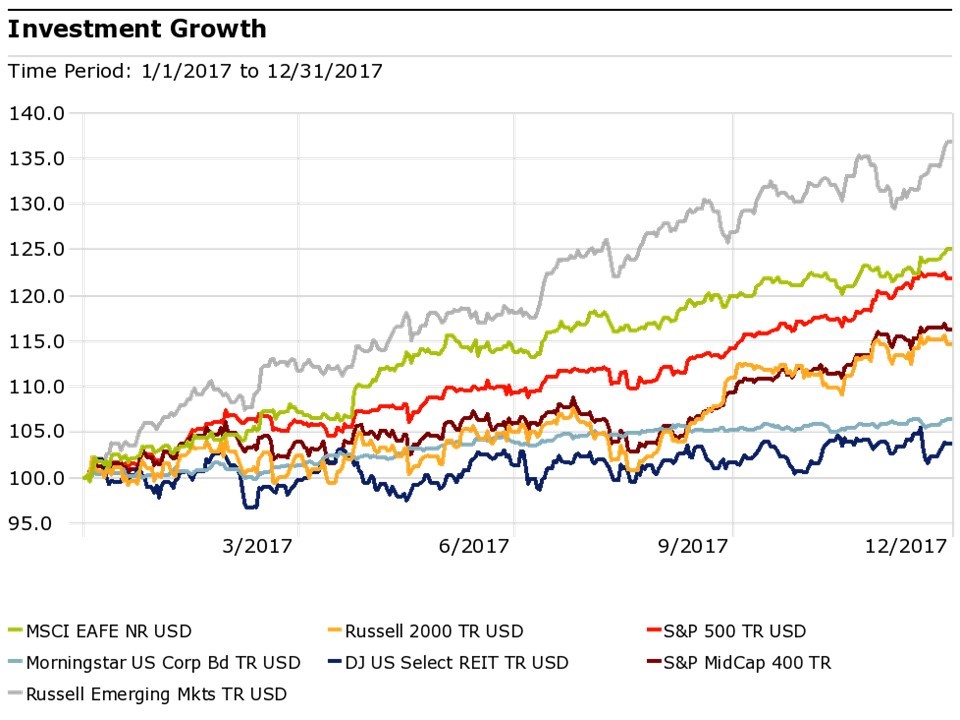
2017 wasn’t a year to have a home-country bias, as is common in the U.S. and most countries. Investors tend to think that their domestic companies are safer, that they can somehow know them better. However, in 2017, going overseas served investors well, as emerging foreign stocks and developed foreign stocks lead the way, the former by a wide margin. This was probably a combination of lower valuations and conditions overseas becoming less bad, or maybe it was just a matter of every dog having its day.
The chart below shows the performance of seven asset classes, including this year’s two winners, over the last ten years. For seven of those years, developed foreign and emerging markets stocks held one of the two lowest spots in the chart (best performing asset classes are at the top; worst, at the bottom.)
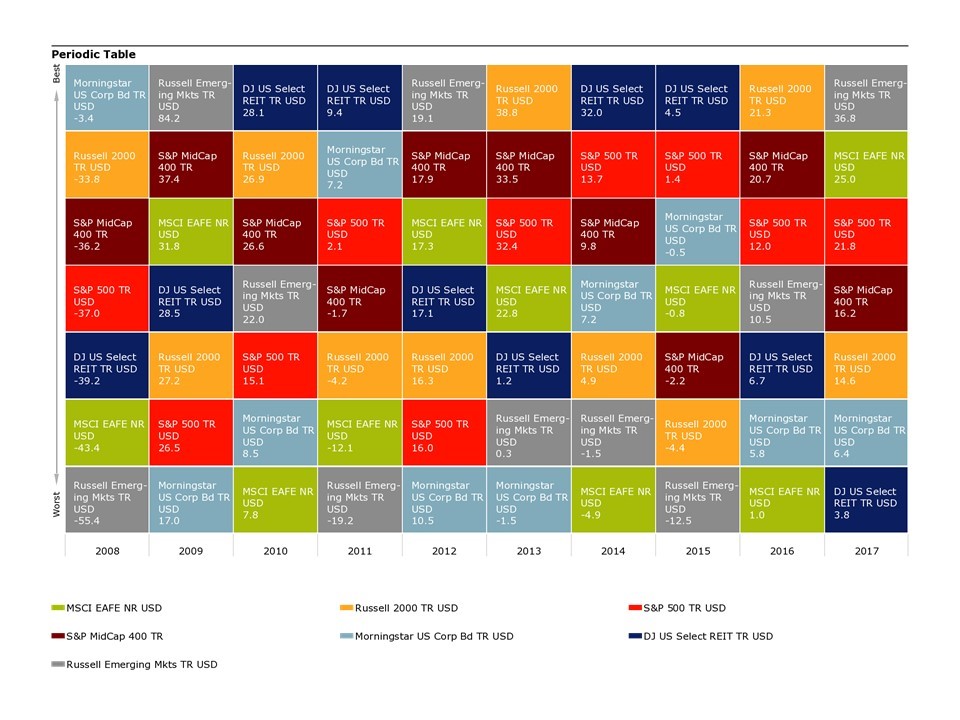
via Morningstar Direct
One reason for investors not to be nervous in 2018 is that there is almost no correlation between yearly returns, as this chart from Bespoke Investment Group shows.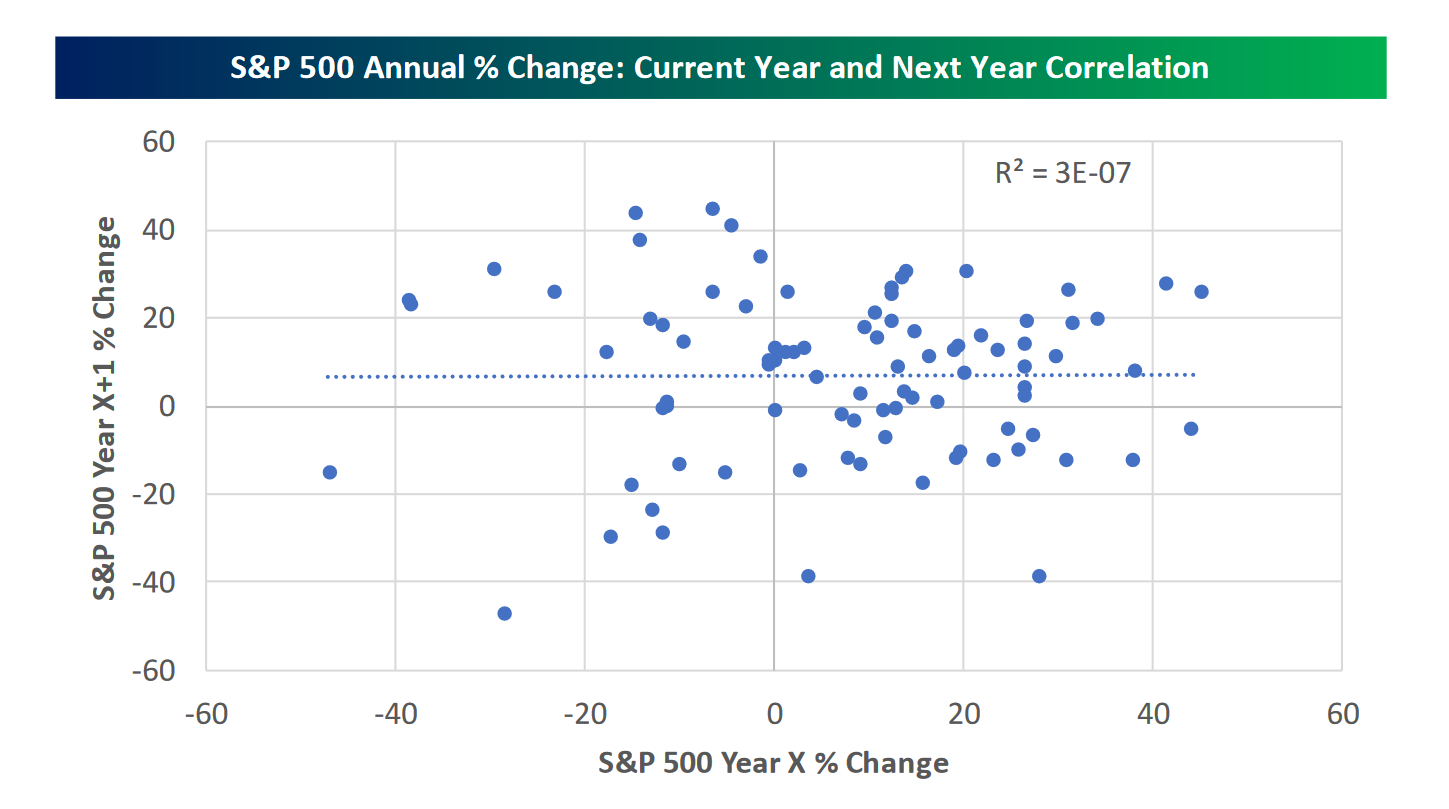
One reason for investors to be nervous in 2018 is valuations. Valuations in securities markets refer to determining the cheapness or richness of an asset class, and they’re almost always done with some reference to another measure, so a stock market can be valued as a multiple of sales (price-to-sales) or earnings (price-to-earnings; P/E) or cashflow (price-to-cashflow.) Apparently, Warren Buffett’s favorite valuation measure compares stock market capitalization, or its total price as determined by all stock prices, compared to GDP. That chart is on display, below, and like many valuation indicators, this one was only higher during the internet bubble.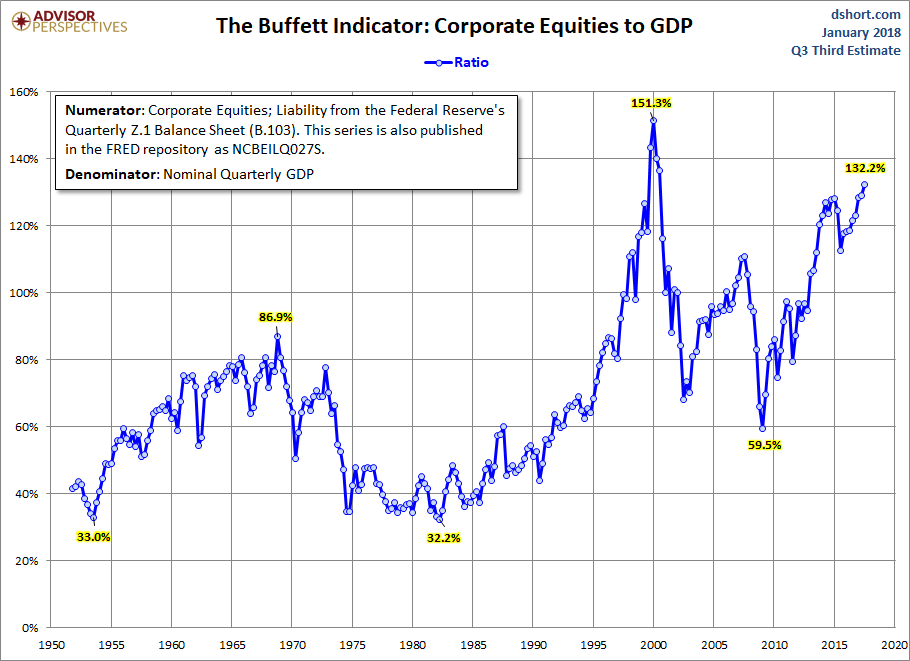
Valuation, however, makes a poor timing tool, which the late ‘90s internet bubble showed. There is no financial law of gravity that dictates how high stocks can go. Had an investor sold at about the time Alan Greenspan made his famous “irrational exuberance” speech (1996), when valuations were at or near an all-time high, said investor would have missed out on much higher returns.
The math for stock market total returns is this:
Total return = dividend yield(%) + earnings growth(%) + change in valuation multiple (%)
This equation shows how high valuations can increase risk (and low valuations, decrease risk), as the change in valuation multiple can swamp the positive dividend and [hopefully] positive earnings growth; a 10% decrease in valuations can completely offset 7% earnings growth and a 3% dividend.
Still, even though valuations are high, they don’t have to be rectified by a sharp correction. Instead, earnings could grow in such a way as to lower the valuation multiple (in a price-to-earnings ratio, for example, earnings are in the denominator, and as the denominator grows, the overall multiple falls.) What the great returns of 2017 have at least done is pull forward part to 2018’s return, as the market anticipates pro-growth tax cuts, and the like, and that means we need to anticipate lower returns going forward.
The opinions voiced in this material are for general information only and are not intended to provide specific advice or recommendations for any individual. All performance referenced is historical and is no guarantee of future results. All indices are unmanaged and may not be invested into directly. The economic forecasts set forth may not develop as predicted. International investing involves special risks such as currency fluctuation and political instability and may not be suitable for all investors. These risks are often heightened for investments in emerging markets.
The MSCI EAFE Index is a free float-adjusted market capitalization index that is designed to measure the equity market performance of developed markets, excluding the US & Canada.
The S&P Midcap 400 Stock Index is an unmanaged index generally representative of the market for the stocks of mid-sized US companies.
The Russell 2000 Index is an unmanaged index generally representative of the 2,000 smallest companies in the Russell 3000 index, which represents approximately 10% of the total market capitalization of the Russell 3000 Index.