Market watchers who tend to think and say, “this can’t go on,” would probably do well to heed the advice of economist, Gordon Popper, who said, “When you see something unsustainable, calculate the maximum period of time that you think it can persist. Then double it.” One should indeed be aware that this is the second longest bull market in U.S. stock market history and that valuations are high, but bull markets do not die of old age, and while there are some signs—margin debt on the New York Stock Exchange is at an all-time high, for example—there aren’t many of the signs that accompany—as they’re called—tops.
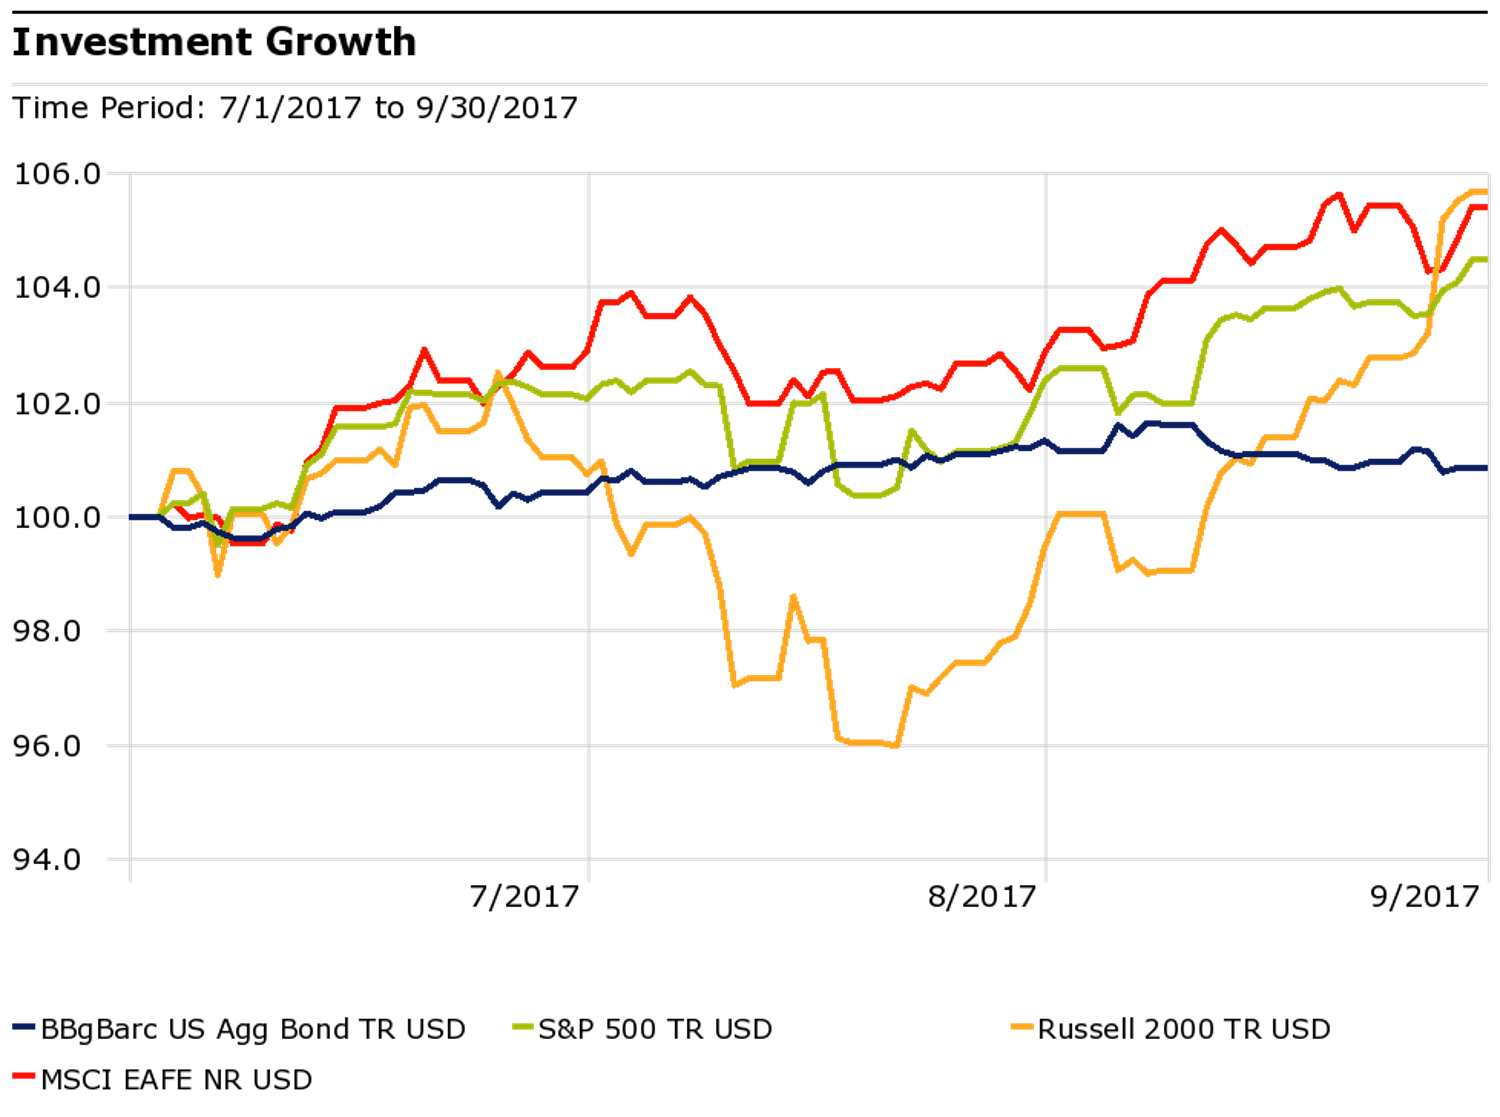
So here is the look at performance for the quarter for four common benchmarks. Each ended the quarter higher than where it began. Bonds played their historic role of offering a relatively smooth ride, while small-cap stocks, as measured by the Russell 2000 index, played their historic role of rollercoaster ride.
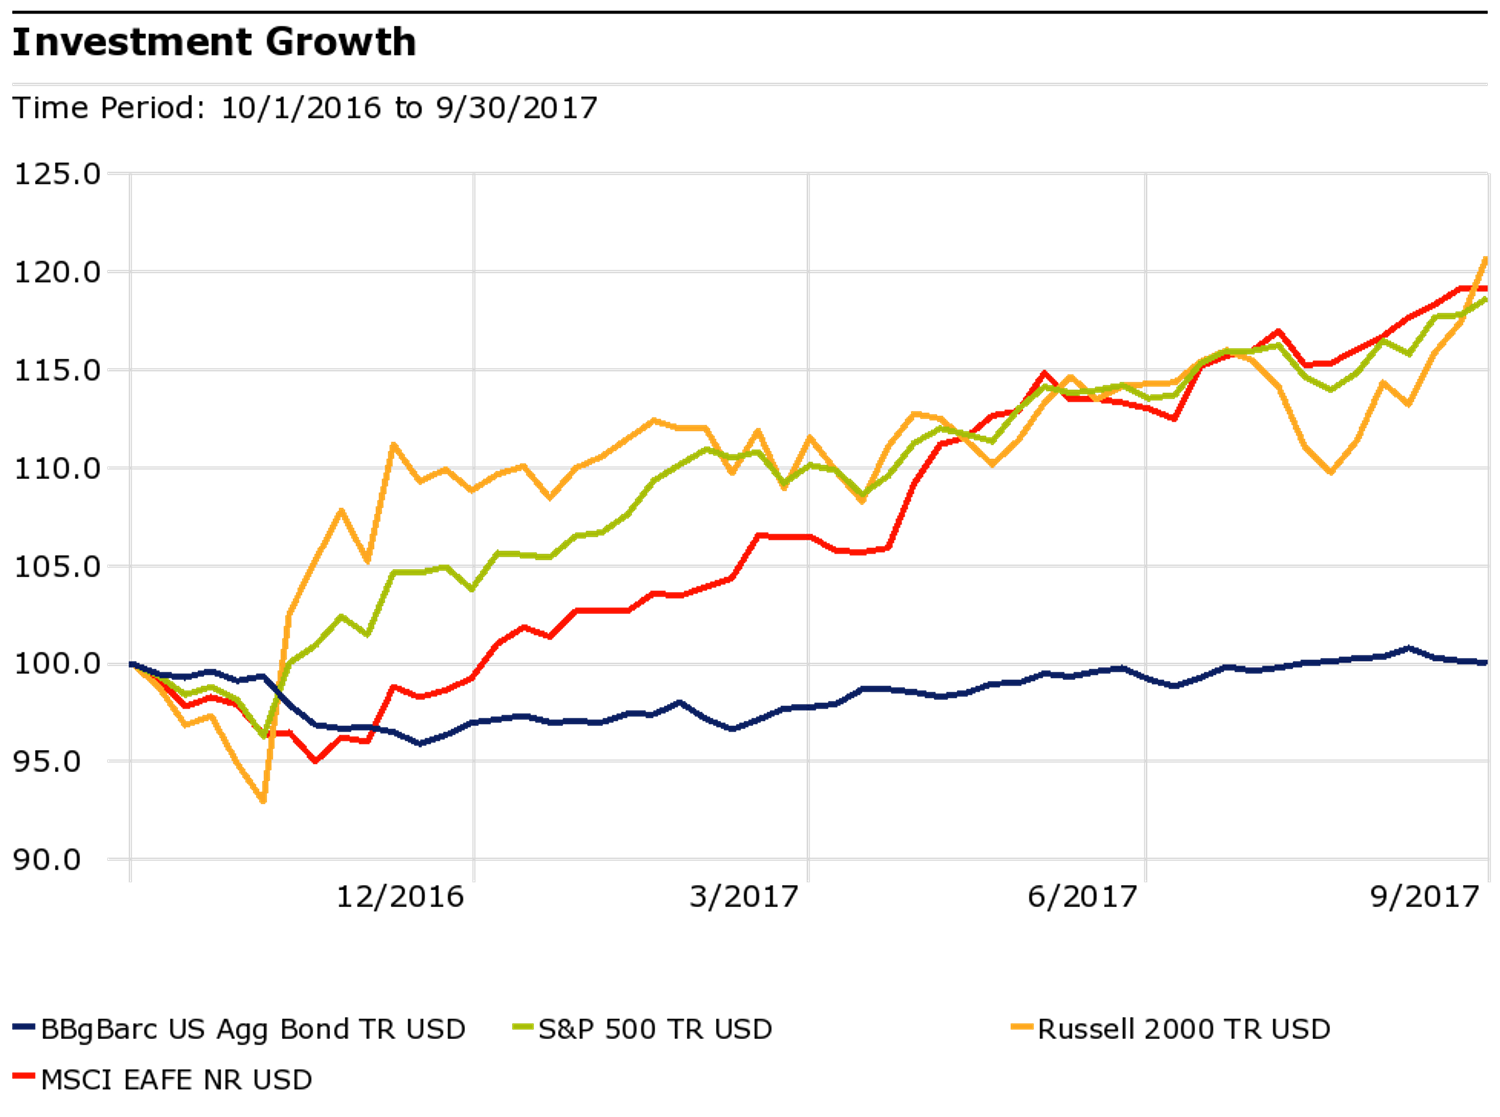
While this chart makes bonds, as measured by the Bloomberg Barclays Aggregate index, look like a contending asset class for much of the quarter, the 12-month view, below, paints a different picture, one of bonds getting left in the dust. Performance like that, along with low yields, leaves us fielding the question of “why bonds?” The answer to why is in the relative shape of the blue line below, relatively flat, which is to say that we think bonds still deserve a spot in asset allocations as a shock absorber, if not a huge contributor to potential returns.
The opinions voiced in this material are for general information only and are not intended to provide specific advice or recommendations for any individual. All performance referenced is historical and is no guarantee of future results. All indices are unmanaged and may not be invested into directly. The economic forecasts set forth may not develop as predicted. Bonds are subject to market and interest rate risk if sold prior to maturity.
The MSCI EAFE Index is a free float-adjusted market capitalization index that is designed to measure the equity market performance of developed markets, excluding the US & Canada.
The Bloomberg Barclays U.S. Aggregate Bond Index is an index of the U.S. investment-grade fixed-rate bond market, including both government and corporate bonds.
The Standard & Poor’s 500 Index is a capitalization weighted index of 500 stocks designed to measure performance of the broad domestic economy.