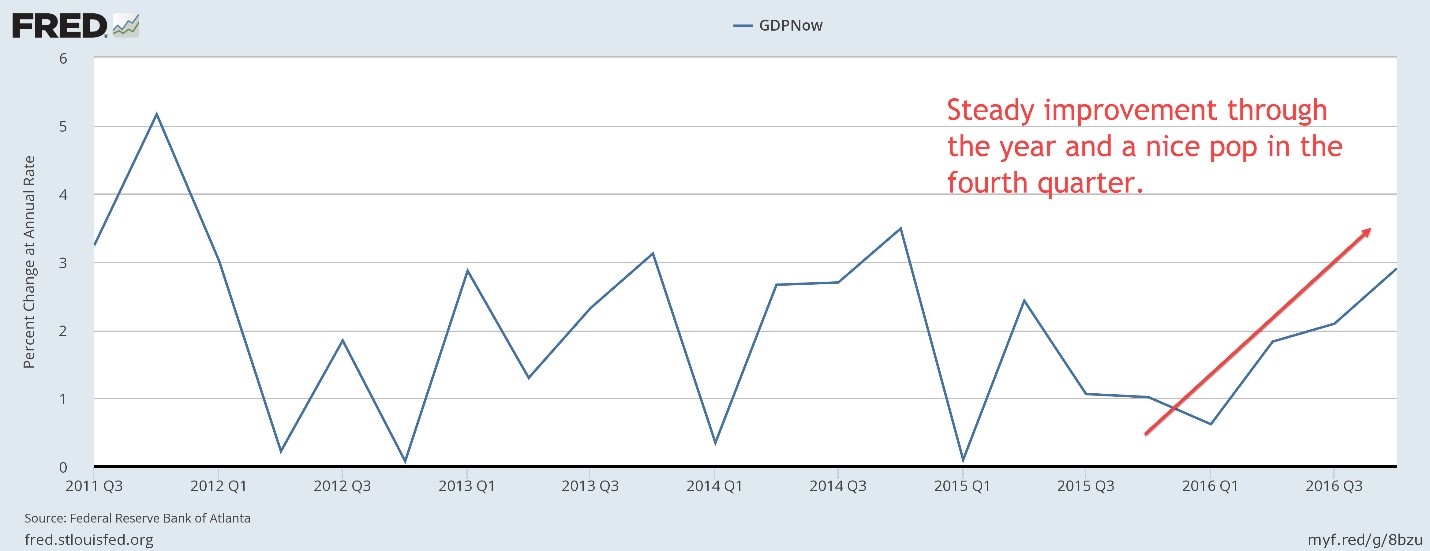
While it is easy to dismiss the Q4 move in the stockmarkets as an overdone reaction to a new party in the White House, there was some justification or the move on the economic front, as evidenced by the GDPNow chart on display, below.
GDPNow is a product of the Atlanta Federal Reserve Bank, and it uses timely data to approximate GDP growth. Importantly, it doesn’t reflect any election optimism other than what might be backed by actual economic activity, such as retailers buying more inventory. We won’t see the first official release of Q4 GDP until January 31, but GDPNow gives us a good idea of what it might look like. Here is the latest version of that indicator.
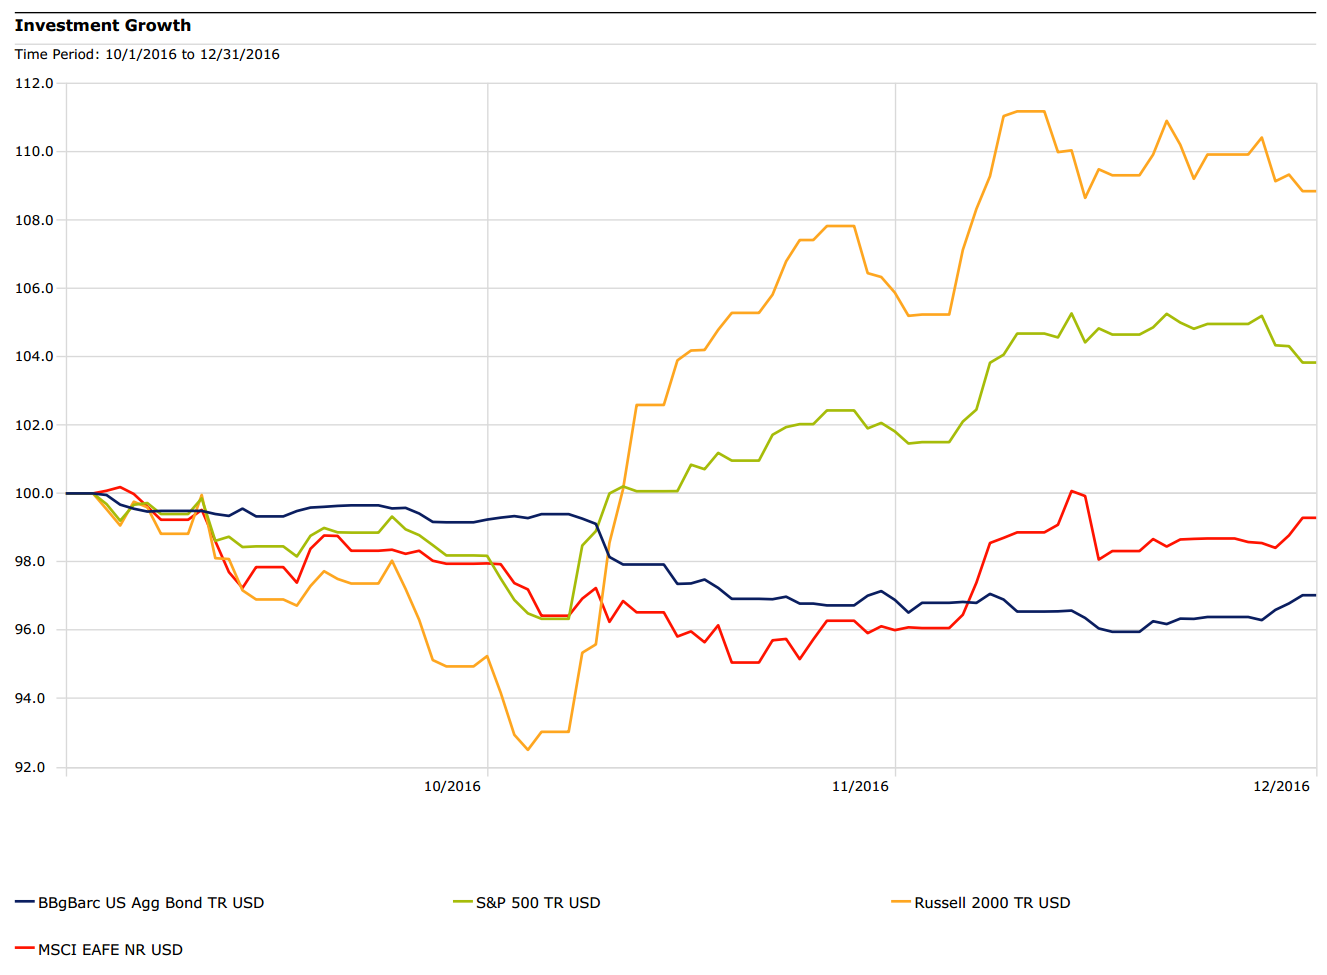
In the fourth quarter, markets performed about in line with measures of volatility, such as Beta. That is, the historically more-volatile small-cap stock segment outperformed large-cap stocks, which would be expected in a rally. Perhaps in response to fears of a seemingly-accepted step back from globalization that many think might be part of a Trump presidency, foreign markets, as measured by the Europe Australasia and Far East (EAFE) index, managed to finish the quarter slightly down.
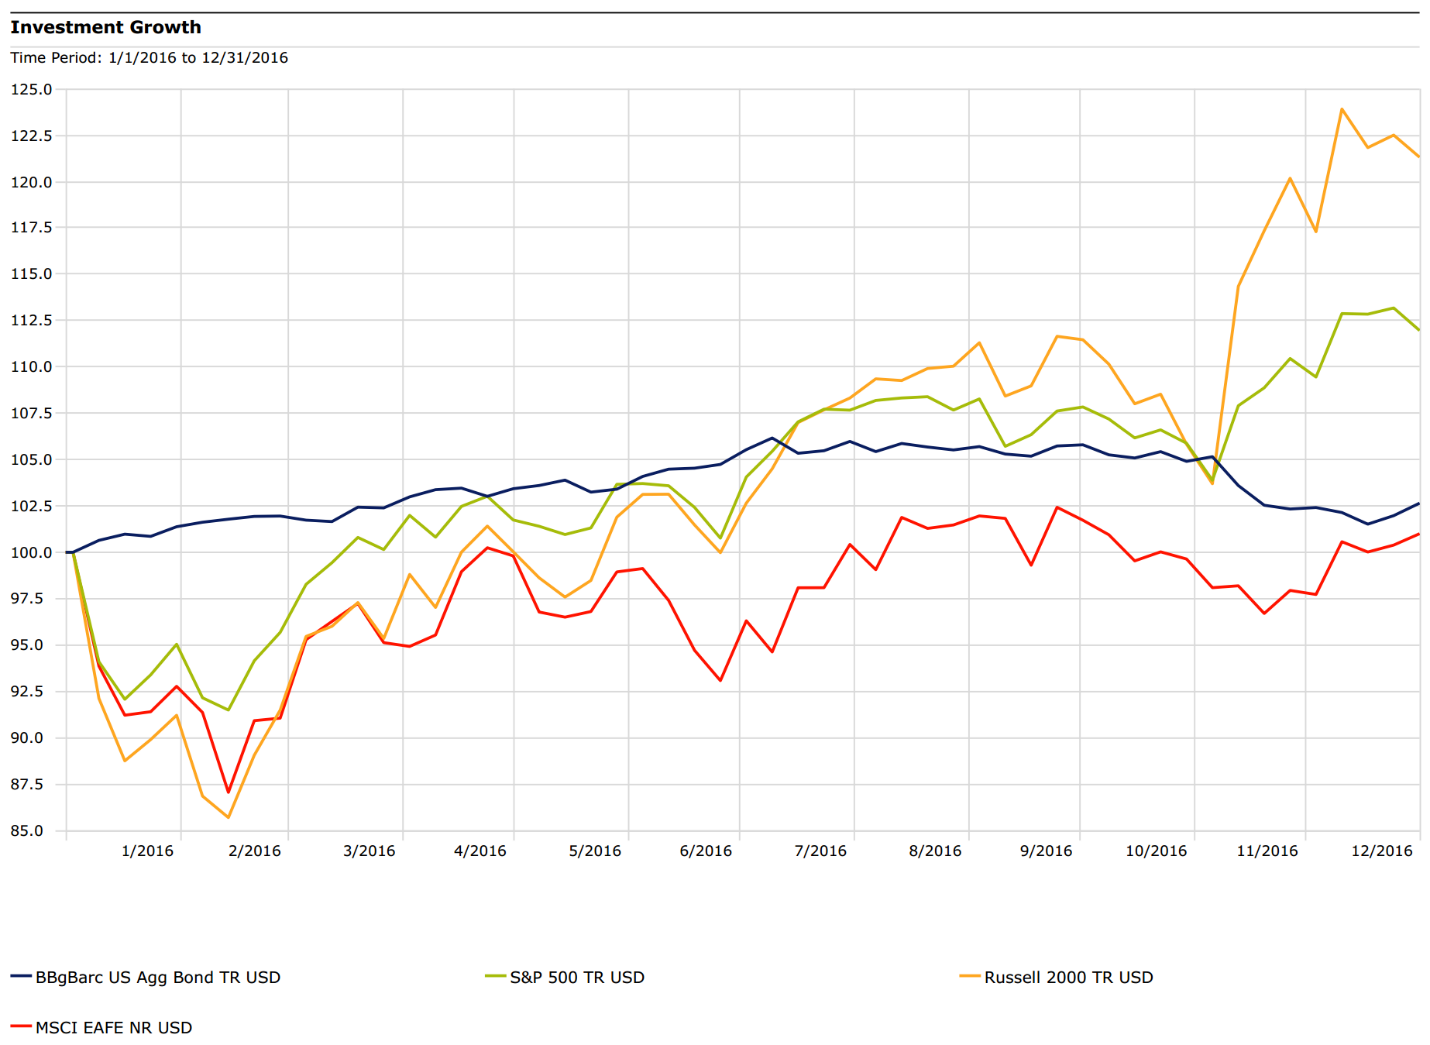
Many, however, had to be pleasantly surprised with full-year results after the disastrous first quarter and ominous forecast from the so-called January Effect, which says, lyrically, “as goes January, so goes the year.” A chart showing 2016 performance is shown below.
Naturally, the only thing that matters is what next? Everyone and his or her brother has their own opinion, and virtually none of them will be right on all of their calls. Barron’s magazine is out with its latest Roundtable issue with pontifications from really smart and successful people, but many of their views are mutually exclusive; they can’t both be right. So, take forecasts with a grain of salt.
The opinions voiced in this material are for general information only and are not intended to provide specific advice or recommendations for any individual. All performance referenced is historical and is no guarantee of future results. All indices are unmanaged and may not be invested into directly. The economic forecasts set forth may not develop as predicted.
Beta is a measure of the volatility, or systematic risk, of a security or a portfolio in comparison to the market as a whole.
International investing involves special risks such as currency fluctuation and political instability and may not be suitable for all investors. Bonds are subject to market and interest rate risk if sold prior to maturity. Bond values will decline as interest rates rise and bonds are subject to availability and change in price.
The Standard & Poor’s 500 Index is a capitalization weighted index of 500 stocks designed to measure performance of the broad domestic economy through changes in the aggregate market value of 500 stocks representing all major industries.
The Russell 2000 Index is an unmanaged index generally representative of the 2,000 smallest companies in the Russell 3000 index, which represents approximately 10% of the total market capitalization of the Russell 3000 Index.
The MSCI EAFE Index is a free float-adjusted market capitalization index that is designed to measure the equity market performance of developed markets, excluding the US & Canada.
The Bloomberg Barclays U.S. Aggregate Bond Index is an index of the U.S. investment-grade fixed-rate bond market, including both government and corporate bonds.