Q3 2016 Returns
When markets fall, there is often a so-called flight to safety, when the less-volatile assets fare the best (least worst) and often attract investment flows. When markets rise, we often see the opposite, a flight to risk, and that is what we saw in the third quarter, where the returns of the asset classes on display below were in line with their historic risks. That is, the riskier asset classes did best, while the less-volatile ones didn’t do as well.
Small-cap stocks (Russell 2000) fared the best; followed by the every-dog-has-its-day foreign equity category (MSCI EAFE); followed by the large-cap U.S. index, the S&P 500. Reversing their performance of the first and second quarters, bonds, as measured by the Barclays Aggregate Index, brought up the rear
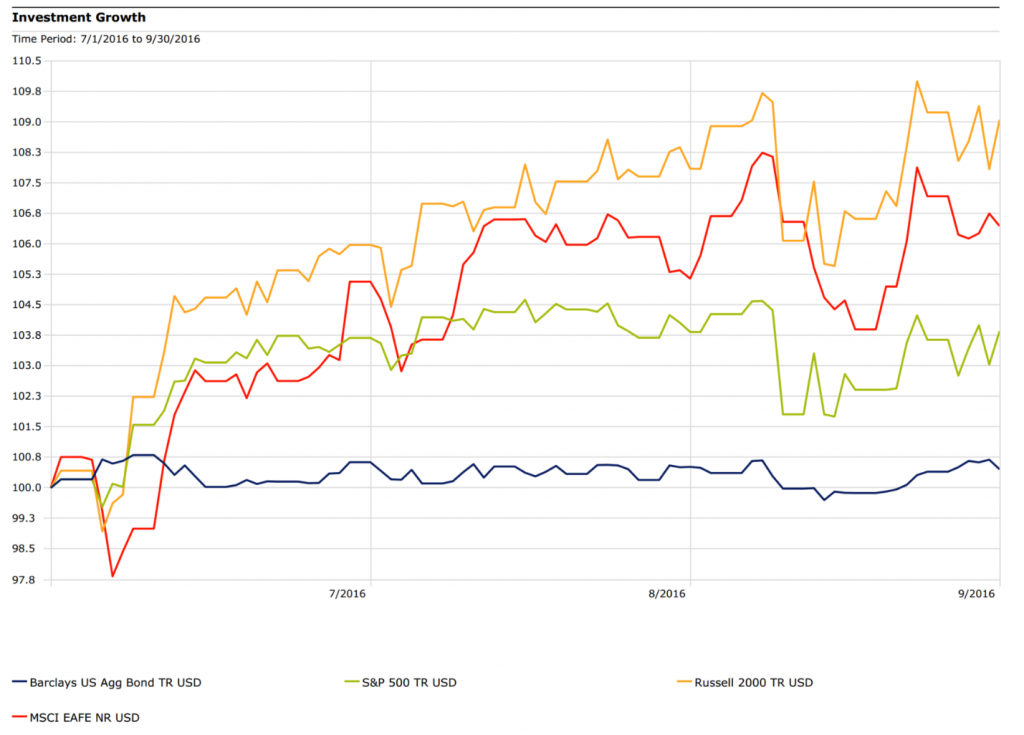
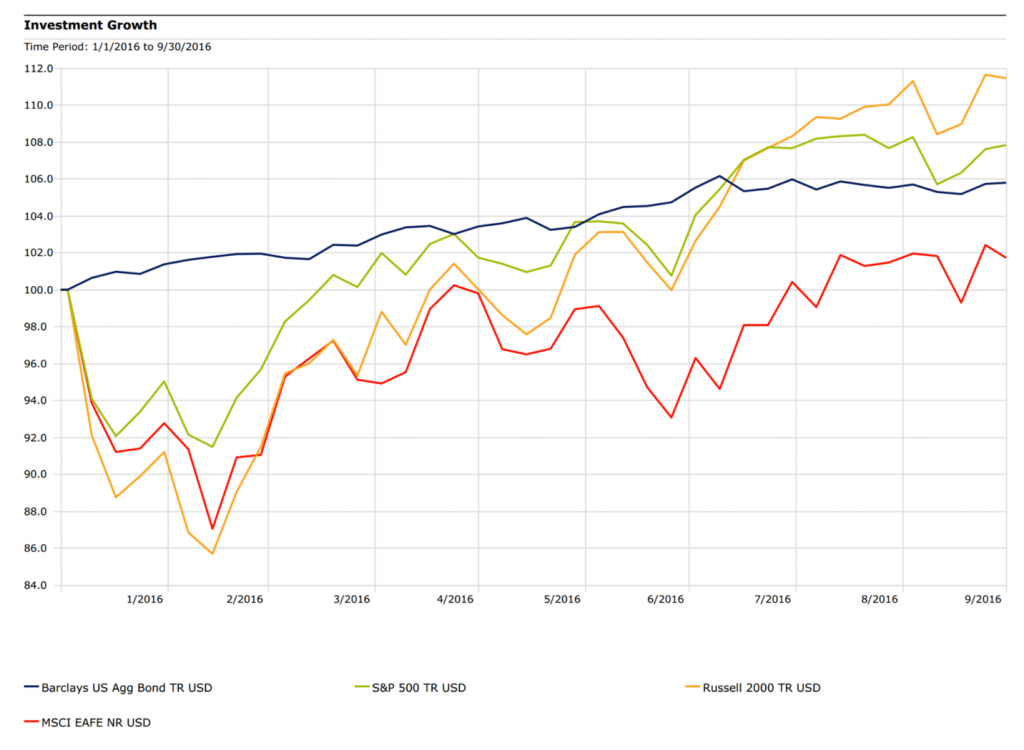
Through September 30, all four asset classes had produced positive returns—even foreign stocks, which had spent much of the year in the red. Early in July, bonds handed off their performance-leading baton to U.S. mid- and large-cap stocks.
The opinions voiced in this material are for general information only and are not intended to provide specific advice or recommendations for any individual. All performance referenced is historical and is no guarantee of future results. All indices are unmanaged and may not be invested into directly.
Stock investing involves risk including loss of principal. The prices of small cap and mid cap stocks are generally more volatile than large cap stocks. International investing involves special risks such as currency fluctuation and political instability and may not be suitable for all investors. Bonds are subject to market and interest rate risk if sold prior to maturity. Bond values will decline as interest rates rise and bonds are subject to availability and change in price.
The Standard & Poor’s 500 Index is a capitalization weighted index of 500 stocks designed to measure performance of the broad domestic economy through changes in the aggregate market value of 500 stocks representing all major industries.
The Russell 2000 Index is an unmanaged index generally representative of the 2,000 smallest companies in the Russell 3000 index, which represents approximately 10% of the total market capitalization of the Russell 3000 Index.
The MSCI EAFE Index is a free float-adjusted market capitalization index that is designed to measure the equity market performance of developed markets, excluding the US & Canada.
The Barclays Capital Aggregate Bond Index is an unmanaged market capitalization-weighted index of most intermediate term U.S. traded investment grade, fixed rate, non-convertible and taxable bond market securities including government agency, corporate, mortgage-backed bonds