
I’m almost certain that every financial advisor has, in the last several months, been asked how the Presidential election will affect the questioner’s investments. Because it seems to be an unwritten commandment—thou shalt not answer, “I don’t know”—I’m inclined to say something like, “well, of course, I don’t know, but I can tell you that, historically, stocks have done better under Democratic administrations.” (I’ve heard this from different sources, but I remember first seeing it laid out by Ned Davis Research.)
Occasionally, the follow-up question gets asked, “so, why is that?” I usually mumble something about Democrats loosening the purse strings—markets tend to like that—and so forth. This is some version of the Narrative Fallacy, in which we tend to search out explanations for results, or as Nassim Taleb says, to weave explanations into the data. After each day’s market action, the news media looks for and/or concocts a narrative for the day’s action—falling oil prices, fears of interest rate hikes, etc.
In fact, the whole stocks-do-better-under-Democrats thing might just a spurious correlation, like the strong correlation (66.6%) between pool drownings and the number of films Nicholas Cage appears in, as is on display in the chart below.
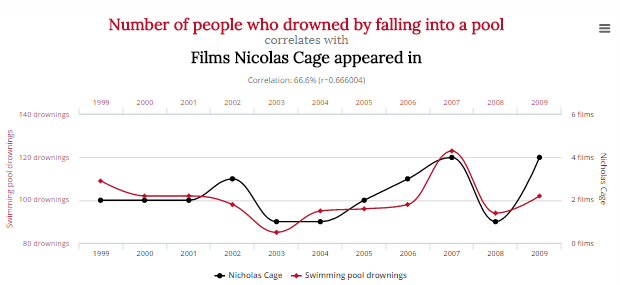
This and fourteen examples of spurious correlations are on display at the blog post “Spurious Correlations: 15 examples,” and the blog Data Science Central.
The next time you ask for an explanation or hear a reason why something happened, don’t forget to ask whether it might just be spurious correlation or an explanation in search of data.
The opinions voiced in this material are for general information only and are not intended to provide specific advice or recommendations for any individual. All performance referenced is historical and is no guarantee of future results.